Halving our electricity usage
I learnt something interesting today: between 2007 and 2011, we halved the amount of electricity we use in our house:
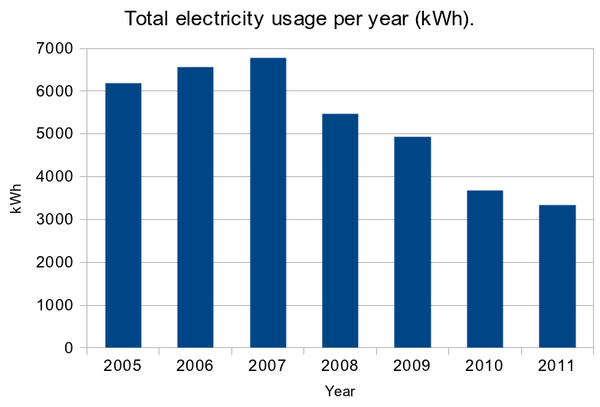
In 2007, we used 6783 kWh of electricity (for electricity, a kilowatt hour is the same thing as a ‘unit’ on your bill). In 2011, by contrast, we used 3332 kWh (or ‘units’). 2007 was slightly on the high side (compared with 2006) because we had no gas fire in the living-room during the winter of 2006-7 so we’d used an electric oil heater during the coldest weeks (we don’t have central heating in that room) 1.
That’s an average of 19 kWh per day in 2007 compared with 9 kWh per day in 2011. Which is quite a difference. So what changed?
In early 2008, I got a plug-in Maplin meter (similar to this one) and one of the very early Current Cost monitors, which display in real-time how much electricity is being used in your whole house:
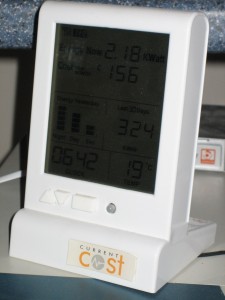
Aside from the fun of seeing the display numbers shoot up when we switched the kettle on, it informed us more usefully that when we went to bed at night or out to work, our house was still using about 350 Watts (which is 3066 kWh per year)2 of electricity. That’s when the house is pretty much doing nothing. Nothing, that is, apart from powering:
- Fridge
- Freezer
- Boiler (gas combi boiler with an electricity supply)
- Hob controls and clock
- Microwave clock
- Infrared outside light sensor
- Print/file server (basically a PC)
- Wireless access point
- Firewall and Internet router
- DAB clock radio
- ADSL modem
- MythTV box (homemade digital video recorder; basically another PC)
And that’s the thing, this ‘baseline’ often makes a lot of difference to how much electricity a house uses overall. 3066 kWh per year was 56% of 2007’s total electricity usage.
The first six items on that list draw less than 100 Watts (876 kWh per year) altogether. They’re the things that we can’t really switch off. But there were clearly things that we could do something about.
Over the next couple of years, we reduced our baseline by about 100 Watts by getting rid of some of the excessive computer kit, buying more efficient versions when we replaced the old print/file server and MythTV box, and replaced most of our lightbulbs with energy-efficient equivalents. We also, importantly, changed our habits a bit and just got more careful about switching lights off when we weren’t using them (which wouldn’t affect the baseline but does affect the overall energy usage), and switching off, say, the stereo amplifier when we’re not using it.
That brought our baseline down to about 230 Watts (2015 kWh per year), which is a lot better, though it’s still relatively high considering that the ‘essentials’ (eg fridge and freezer) contribute less than half of that.
And that’s about where we are now. We tended to make changes in fits and starts but none of it has been that arduous. I don’t think we’re living much differently; just more efficiently.
1The complementary gas usage graph shows lower gas for that year for the same reason; I’ll blog about gas when I have a complete set of readings for 2011).
2350 Watts divided by 1000, then multiplied by 8760 hours in a year.
Photo of the Current Cost monitor was by Tristan Fearne.
Thanks also to @andysc for helping create the graph from meter readings on irregular dates.